

Suvrath Arvind
Class of 2024
About
Projects
- "Part of Speech Distributions for Grimm Versus Artificially Generated Fairy Tales" with mentor Clayton (Oct. 9, 2023)
- "Analyzing the Distribution of Energy Sources in the United States" with mentor Clayton (May 15, 2023)
- "Predicting the Number of Sunspots Per Month and Per Quarter Using ARIMA Models" with mentor Clayton (Oct. 17, 2022)
Suvrath's Symposium Presentation
Project Portfolio
Part of Speech Distributions for Grimm Versus Artificially Generated Fairy Tales
Started June 21, 2023
Abstract or project description
The dramatic increase in quality of natural language generation from large language models, popularized by ChatGPT, has made many wonder about statistical differences between naturally generated and artificially generated text. To constrain our problem, we considered fairy tales as these texts have existed for centuries. To explore statistical differences, we focused on the distribution of words according to their parts of speech. We generated a novel corpus of 101 fairy tales “authored” by ChatGPT. We compared this against 209 fairytales written by the Grimm Brothers and made available freely online. Our hypothesis was that the distributions of parts of speech for Grimm fairy tales and ChatGPT fairy tales are different and when comparing the POS distributions of Grimm fairy tales and ChatGPT fairy tales individually, our hypothesis was that the part of speech distributions will vary among Grimm fairy tales more than those among ChatGPT fairy tales. We performed appropriate preprocessing and computed total variation distances for individual fairytales within and between authorship conditions. We found out that in fact, the distribution of parts of speech in ChatGPT fairy tales is significantly different from the distribution of parts of speech in Grimm fairy tales.
Project Portfolio
Analyzing the Distribution of Energy Sources in the United States
Started Nov. 8, 2022
Abstract or project description
The United States is one of the largest consumers of energy in the world, but this energy comes from a wide variety of sources. In addition, this energy consumption varies from state-to-state and from sector-to-sector, meaning that no one model would tell us the full story of the energy distribution in the United States. The goal of this project was to analyze this data, using various techniques to develop our understanding of the nature of the data we were provided with. To effectively analyze the data, we created three groups of data: individual energy sources, energy by state, and energy by sector. Our analysis showed us that energy sources, like coal, appeared to be decreasing in consumption, that states could be grouped in clusters in order to predict production of coal from consumption (coal was the main energy source we analyzed), and that other aspects of the energy distribution (consumption and expenditure, for example) were almost perfectly correlated.
Project Portfolio
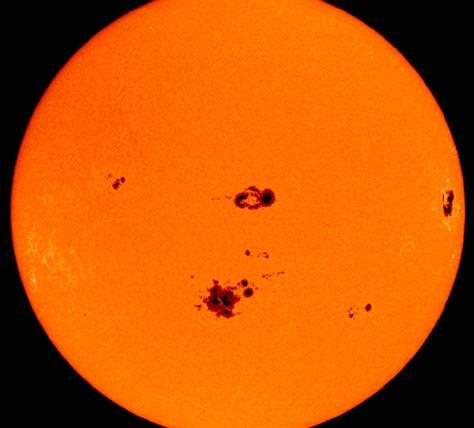
Predicting the Number of Sunspots Per Month and Per Quarter Using ARIMA Models
Started Aug. 11, 2022
Abstract or project description
The number of sunspots in a given year changes as the sun goes through solar cycles, with peaks happening at regular intervals. When these peaks are plotted, a curve appears, similar to the oscillating sinusoidal wave. Because of its oscillatory nature, predictions of future sunspot values could be found since it is safe to assume that the number of sunspots would always follow a pattern. However, a simple, ordinary sine function, or any algebraic function for that matter, would not allow us to plot and predict future data points due to the complexity of the curve at hand. This led us to the hypothesis that in order to predict the future number of sunspots, models that involve autoregressive and moving average components (namely the ARIMA model) would be the most effective. In order to measure effectiveness, the mean-squared error (MSE) would be used, with a lower value (closer to 0) meaning better fit. The reason why we chose these sophisticated models was because these models took into account prior data points and their trends and seasonality to predict future data points. This essentially meant that this model would predict based on prior points, not on a fixed point or equation, like the sine curve. After plotting all of these models and finding the MSE for each, we drew the conclusion that the ARIMA model proved to produce the most accurate curve, with a MSE of only 460, as compared to the MSE that the best sine curve could produce: 21 million.